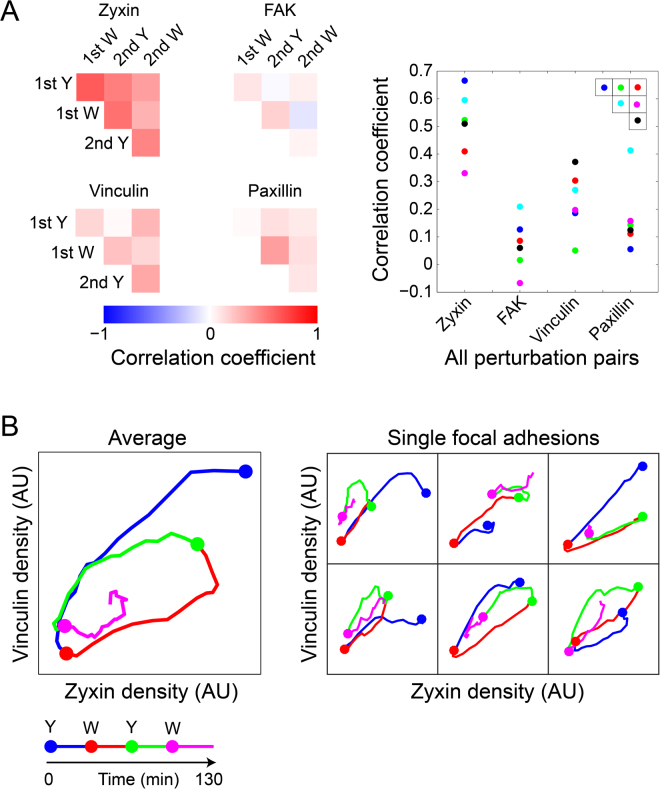
Figure 5.
Diverse patterns of molecular changes among single focal adhesions in response to repeated ROCK perturbations. Focal adhesions which were present throughout both ROCK perturbations cycles were identified in 6 selected cells (n = 58 focal adhesions). (A) Heatmaps of the Pearson correlation coefficients between the strengths of the responses of each protein to the different perturbations. The response strengths to Y-27632 (Y) and washout (W) were calculated as log density (before/14′ after perturbation) and log density (14′ after perturbation/before), respectively. The plot shows the values of the correlation coefficients, color coded according to their positions in the corresponding heatmaps. For robust quantification of responses per individual focal adhesions, values of 3 sequential time frames were averaged before and at 14 minutes after each perturbation. (B) Phase-space plots of the densities of zyxin versus vinculin along the experiment, either averaged over the single focal adhesions (Left, n = 58) or for six single focal adhesions from one cell (right). The time-points of Y-27632 (Y) additions and washouts (W) are indicated color-coded by the filled circles.

