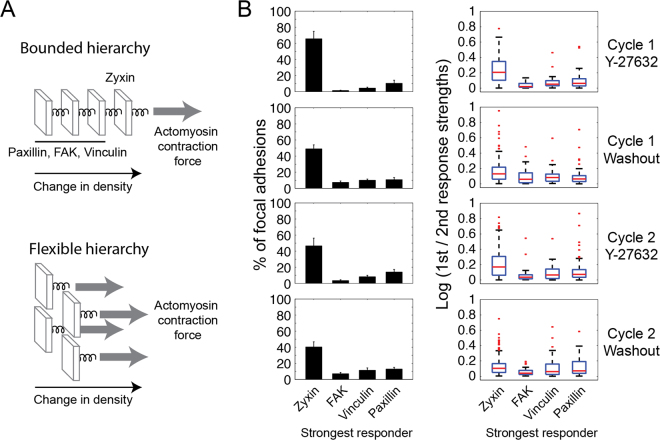
Figure 6.
Diverse hierarchies of response extents of zyxin, FAK, vinculin and paxillin to ROCK perturbations. (A) A bounded hierarchy imposes a fixed order between the response extents of the proteins, metaphorized here as components linearly connected by springs, so that no component can be pulled more than the component on its right side. A flexible hierarchy enables different proteins to be the strongest responders, illustrated as components connected in parallel to the pulling force. (B) The bar plots (left column) show the percentages of focal adhesions having the indicated stronger responder upon each perturbation. A protein was counted as a stronger responder only if its response is at least 10% bigger than the responses of the other three proteins. Error bars indicate standard error of the mean (n = 10 cells). The box plots (right column) show the ratio between the strongest response and the second strongest response in focal adhesions having the indicated strongest responder. The response strength is calculated as log (density before/14′ after perturbation) for Y-27632 addition and as log (density 14′ after perturbation/before) for washout. In all box plots, boxes indicate the interquartile range (IQR) between the first and third quartiles and the line within indicates the median. Whiskers denote the lowest and highest values within 1.5IQR from the first and third quartiles, respectively. Red dots indicate data points beyond the whiskers. For robust quantification of responses per individual focal adhesions the values of 3 sequential time frames were averaged before and at 14 minutes after each perturbation.

