
Figure 3.
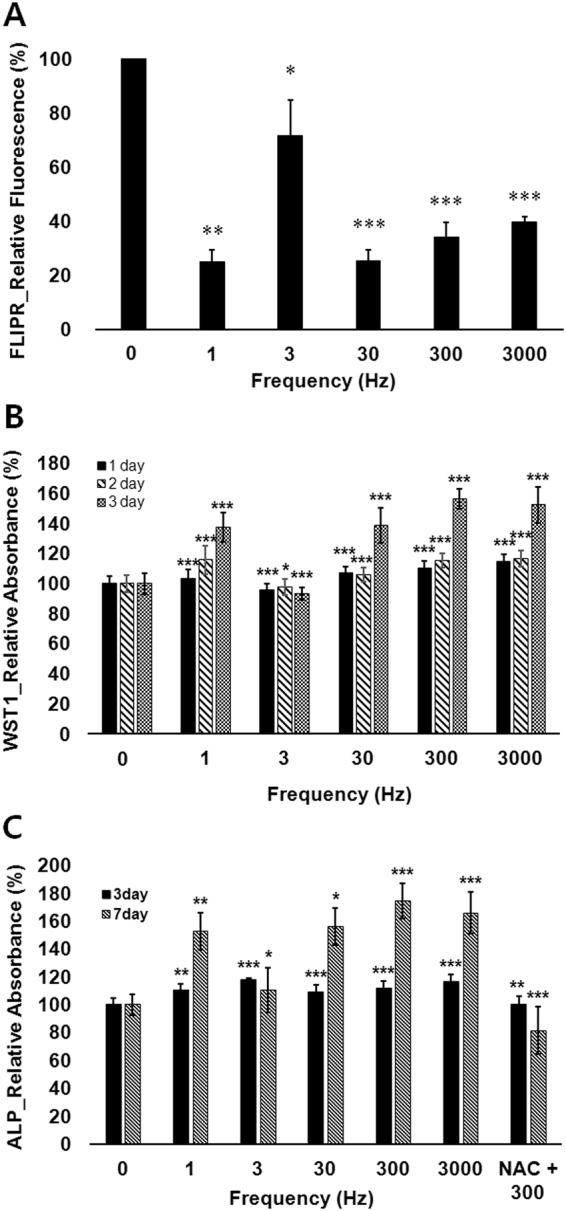
Effects of frequency of PW-LPL on hDPSC cytoplasmic membrane potential, metabolic activity, and ALP activity. (A) FLIPR fluorescence intensities of hDPSCs relative to control just after 77 mJ/cm2 PW-LPL in 1, 3, 30, 300, or 3000 Hz with same 30% duty cycle (n = 3 in each experiment and 3 replicates). (B) Metabolic activities of hDPSCs relative to control for 3 days after 77 mJ/cm2 PW-LPL in 1, 30, 300, or 3000 Hz with same 30% duty cycle (n = 10 in each experiment and 3 replicates). (C) ALP activity absorbance relative to control for 7 days after 77 mJ/cm2 PW-LPL in 1, 30, 300, or 3000 Hz with same 30% duty cycle. NAC was added for the case of 300 Hz PW-LPL (n = 10 in each experiment and 3 replicates).