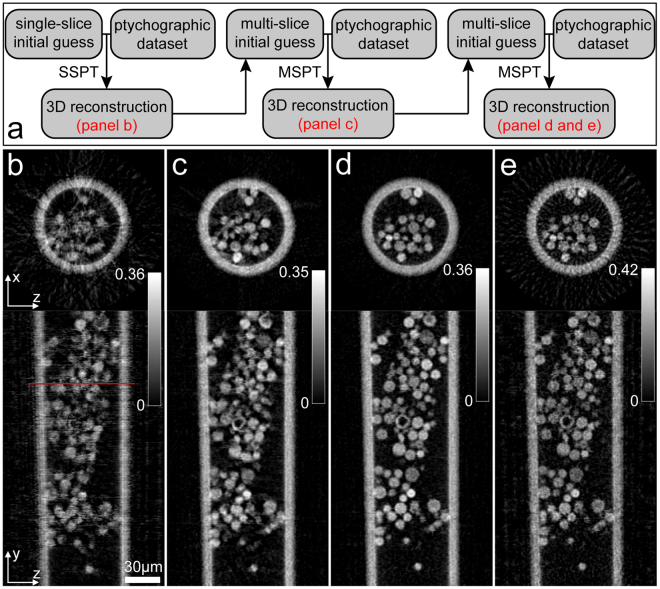
Figure 8.
The reconstructions of multi-slice ptychographic tomography using 30 angular measurements. (a) The reconstruction pipeline. (b) Cross-sections of the tomographic reconstruction using the selected 30 reconstructions from the single-slice ptychography. (c) Cross-sections of the tomographic reconstruction using the generated 90 projections from the first multi-slice ptychographic reconstructions. (d) Cross-sections of the tomographic reconstruction using the generated 90 projections from the second multi-slice ptychographic reconstructions. (e) Cross-sections of the tomographic reconstruction using the 30 orthogonal projections from the second multi-slice ptychographic reconstructions.

