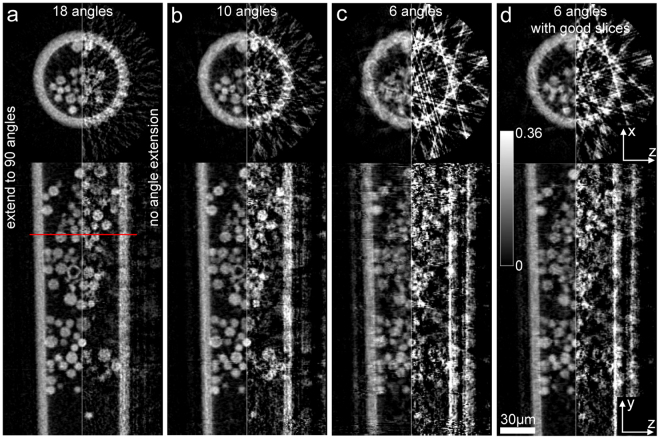
Figure 9.
The reconstructions of multi-slice ptychographic tomography using (a) 18, (b) 10 and (c,d) 6 angular measurements. For (d), good slices reconstructions from the case of complete 90 angles are used for the angle extension here. The top row is the x-z cross-sections of the 3D sample reconstruction at the positions indicated by the red line. The bottom row is the central y-z cross-sections. In each pane, the left hand side is the reconstruction after the angle extension and the right hand side is the reconstruction without the angle extension.

