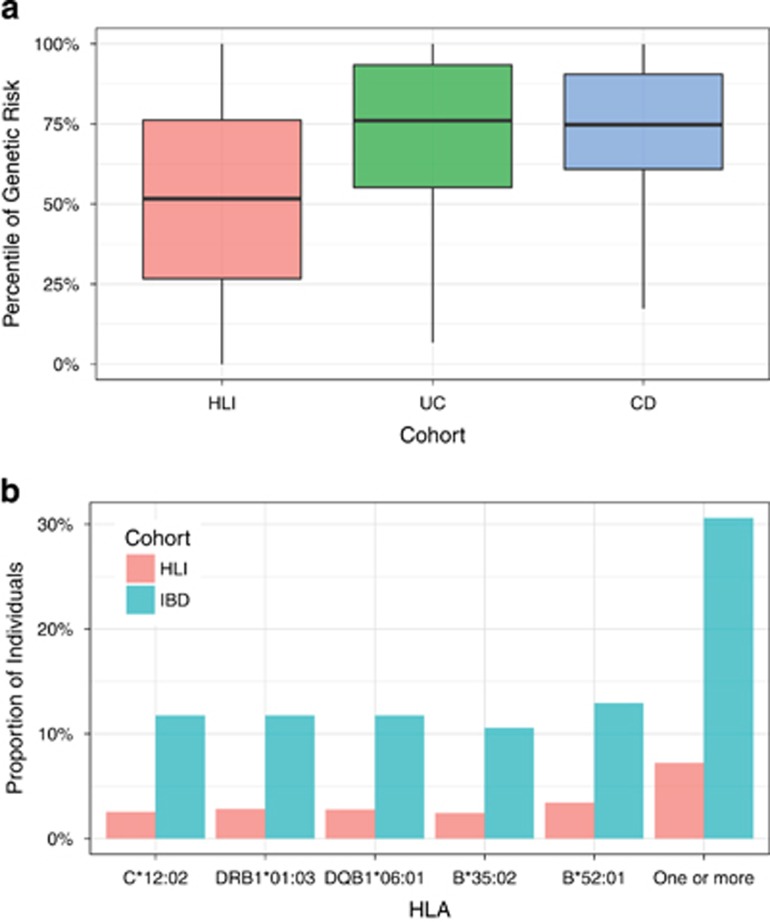
Figure 2.
Genetic predisposition to IBD in patients compared to the general population. (a). Genetic risk score. The y-axis is the percentile of the IBD genetic risk. The general reference population has 10,545 individuals, composed of 8,253 EUR, 1,394 AFR, 315 MDE, 238 EAS, 212 AMR, and 132 CSA. (b). The frequency of HLA alleles significantly associated with IBD. The top panel shows the frequencies (on the y-axis) of the IBD-associated HLA alleles (on the x-axis)

