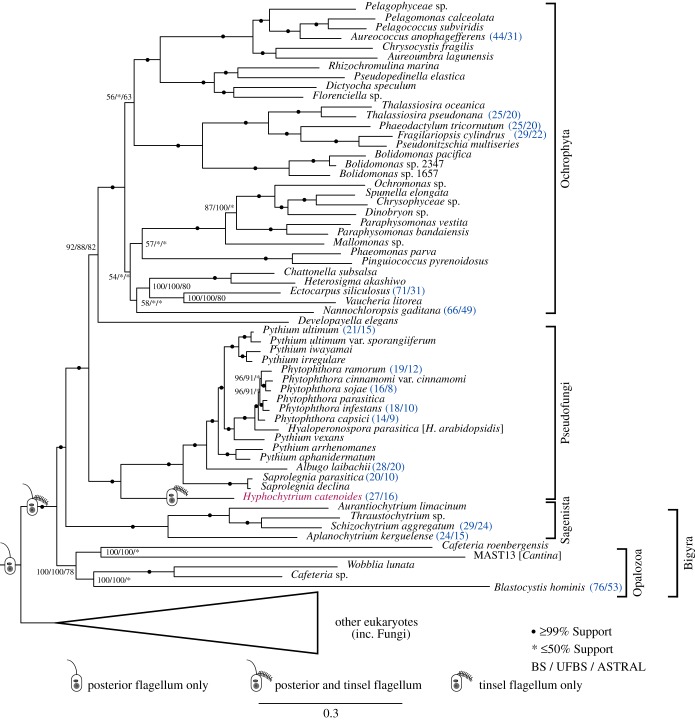
Figure 2.
A subsection of the 325 gene (90 230 amino acid) phylogeny of eukaryotes (electronic supplementary material, figure S6a) demonstrating the branching position of Hyphochytrium. Hyphochytrium highlighted in magenta. The ML tree was built using a supermatrix approach in IQ-TREE under the site heterogeneous model of evolution, LG + Γ4 + FMIX(empirical, C60) + PMSF. Values at nodes are ML bootstrap (MLBS) (100 real BS replicates in IQ-TREE LG + Γ4 + FMIX(emprical, C60) + PMSF), MLBS under the partitioned dataset using the LG + G4 model of evolution per partition (1000 ultrafast BS replicates) and 100 ASTRAL coalescence multilocus bootstrap replicates, respectively. Bootstrap values below 50% are denoted as an asterisk. Circles denote 99% or above values from all tree topology support analyses. Cartoons of cells indicate change in stramenopile flagellum morphology. Figures highlighted in blue and in parentheses after taxon names are the numbers returned by CEGMA for the complete/partial predicted frequency of 248 CEGs.

