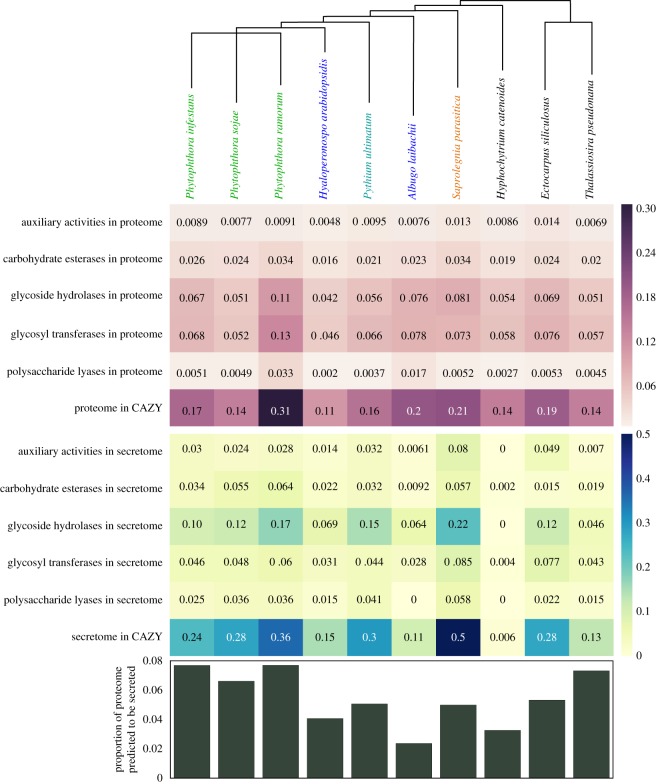
Figure 3.
Comparison of secreted proteome and putative carbohydrate active proteins across the Pseudofungi including photosynthetic stramenopile taxa as an outgroup. The schematic phylogeny at the top indicates the relationship between different oomycete species with the ‘lifestyle’ of each species indicated by text colour; green (Phytophthora species) indicates plant hemibiotroph, blue (Hyaloperonospora and Albugo) obligate plant biotroph, teal (Pythium) plant necrotroph, orange (Saprolegnia) animal saprotroph/necrotroph and black indicates putatively free living (e.g. Hyphochytrium, Ectocarpus and Thalassiosira). The first heat map in white/purple indicates the proportion of proteome of each organism which was identified as belonging to a particular CAZY (www.cazy.org) category using BLASTp with an expectation of 1 × 10⁻⁵. The number listed is the proportion, and the colour relates to magnitude of the listed number (as shown by scale bar). The second heat map, in blue/yellow, indicates the proportion of the secretome (predicted via a custom pipeline https://github.com/fmaguire/predict_secretome/tree/refactor) that is identified as belonging to each of these CAZY categories. Auxiliary activities (AA) cover redox enzymes that act in conjunction with CAZY enzymes. The bar chart at the bottom shows the proportion of the proteome for each organism which is predicted to be secreted.

