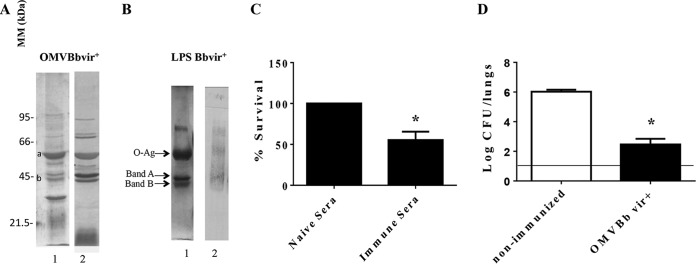
FIG 3.
(A) Analysis of OMVBbvir+ antigenic reactivity by 12.5% (wt/vol) SDS-PAGE, visualized by staining with Coomassie brilliant blue (lane 1). Molecular masses are indicated on the left. Immunoblots with the OMVBbvir+ protein sample were probed with polyclonal antisera obtained from mice immunized with OMVBbvir+ (lane 2). Bands a and b were identified as GroEL and OMPc, respectively. (B) Analysis of purified B. bronchiseptica LPS by 15% (wt/vol) SDS-PAGE (lane 1) and by immunoblotting with the polyclonal antisera obtained from mice immunized with OMVBbvir+ (lane 2). The arrows indicate the locations of the O antigen and bands A and B that were recognized by the antisera used for immunoblotting in lane 2. (C) In vitro killing assay of B. bronchiseptica with immune sera derived from OMVBbvir+-vaccinated animals and from nonimmunized mice. Three biological replicates were performed, with the results from a representative one being presented. The percent survival of the bacteria is plotted on the ordinate for each of the sera indicated on the abscissa. *, significant difference (P < 0.05). (D) Effect of passive immunization with sera collected from OMVBbvir+-immunized mice. B. bronchiseptica 9.73 was used as the challenge bacteria (5 × 10⁵ CFU, in 40 μl). Three biological replicates were performed, with the results from a representative one being presented. The data are the mean values from four mice per group at 7 days after challenge. The horizontal line indicates the lower limit of detection. The number of bacteria recovered from the mouse lungs, expressed as the mean ± SEM (error bars) of log10 CFU in the lungs, is plotted on the ordinate for each of the experimental groups indicated on the abscissa. *, significant difference (P < 0.001).

