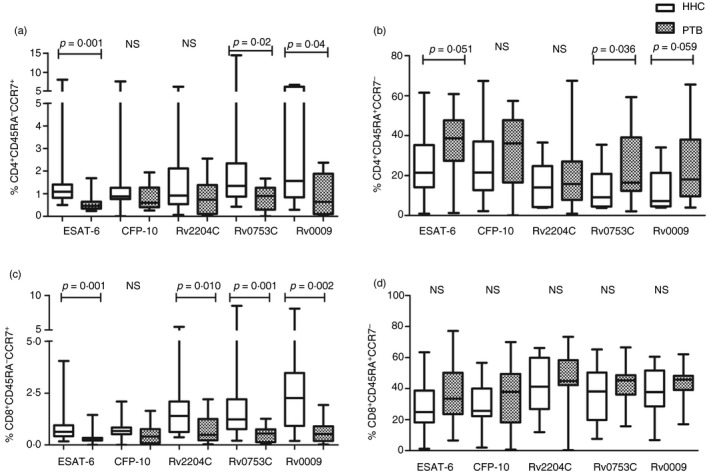
Figure 2.

Percentage of effector and memory CD4+ and CD8+ T cells in healthy household contacts (HHC) and patients with pulmonary tuberculosis (PTB). The percentages of effector and memory T cells among the CD4+ and CD8+ T cells of 15 individuals with latent tuberculosis infection (LTBI) and 15 PTB participants are represented as box plots with whiskers. The bottom and top lines of the boxes are the first and third centiles, the middle line inside the box is the median, and the whiskers represent the range. (a) CD4+ CCR7+ CD45RA − central memory T (Tcm) cells, (b) CD4+ CCR7− CD45RA + effector T cells, (c) CD8+ CCR7+ CD45RA − Tcm cells, (d) CD8+ CCR7− CD45RA + effector T cells. Differences between the groups were compared using a Mann–Whitney U‐test. Statistical differences with p < 0·05 are considered significant and shown in the plot. NS, non‐significant.
