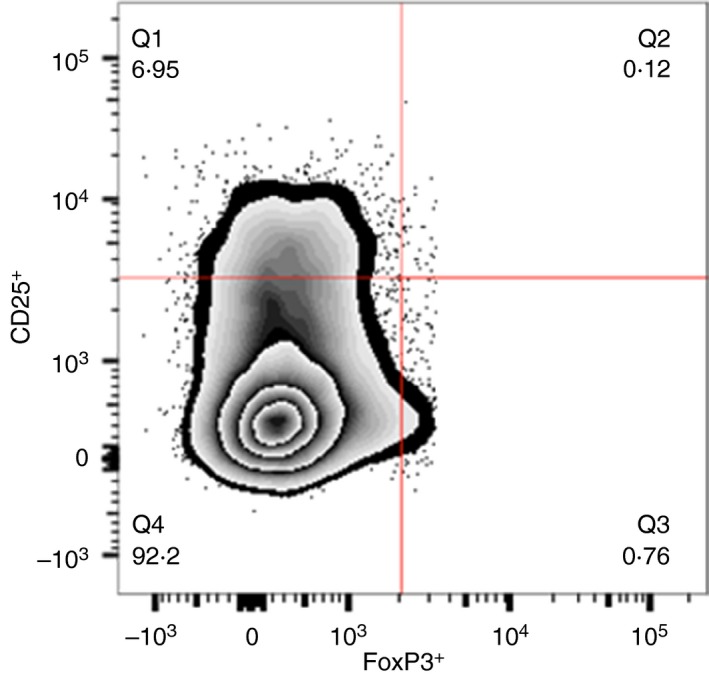
Figure 3.

Representative flow cytometry plot for CD25 and FoxP3 expression by regulatory T (Treg) cells. This figure shows the representative flow cytometry plot of CD4+ Treg cells expressing CD25 and FoxP3 from a patient with active tuberculosis (TB). The numbers in the quadrants indicate the percentages of cells expressing CD25 and/or FoxP3 among the CD4+ population. Q1, CD3+ CD4+ CD25+ FoxP3− (CD4+ FoxP3− Treg cells); Q2, CD3+ CD4+ CD25+ FoxP3+ (CD4+ Treg cells); Q3, CD3+ CD4+ CD25− FoxP3+ (CD4+ FoxP3+ Treg cells); Q4, CD3+ CD4+ CD25− FoxP3− T‐cell subset. The same gating strategy was followed for all antigens. [Colour figure can be viewed at wileyonlinelibrary.com]
