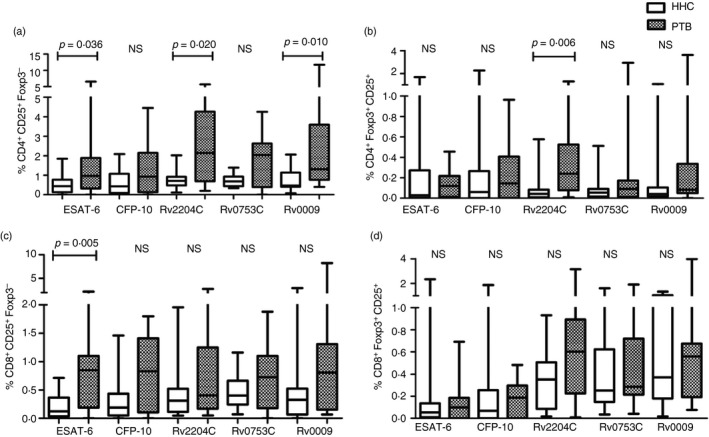
Figure 4.

Frequency of CD4+ and CD8+ regulatory T (Treg) cells in healthy household contacts (HHC) and patients with pulmonary tuberculosis (PTB). The percentages of regulatory T cells (CD25 and FoxP3) among the CD4+ and CD8+ T cells of 15 individuals with latent tuberculosis infection (LTBI) and 15 patients with PTB are represented as box plots with whiskers: the bottom and top lines of the boxes are the first and third centiles, middle line indicates median value, and the whiskers represent the range. (a) CD4+ CD25+ FoxP3− (CD4+ FoxP3− Treg cells), (b) CD4+ CD25+ FoxP3+ (CD4+ Treg cells), (c) CD8+ CD25+ FoxP3− (CD8+ FoxP3− Treg cells), and (d) CD8+ CD25+ FoxP3+ (CD8+ Treg cells). Differences between the groups were compared by non‐parametric Mann–Whitney U‐test. Statistical differences with p‐values are shown in the graph. NS, non‐significant.
