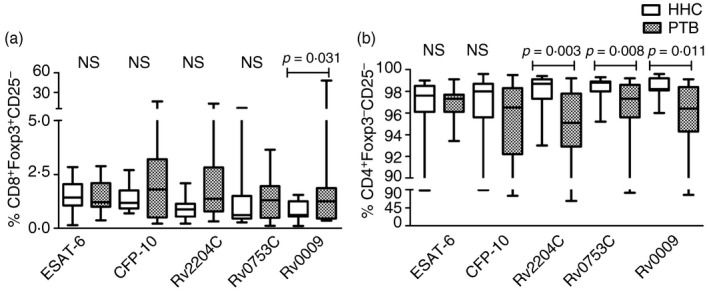
Figure 5.

Frequency of CD25− FoxP3+ and CD25− FoxP3− T‐cell subsets in healthy household contacts (HHC) and patients with pulmonary tuberculosis (PTB). The percentages of regulatory T‐cell subsets (CD25 and FoxP3) of 15 individuals with latent tuberculosis infection (LTBI) and 15 patients with PTB are given as whisker box plots. The bottom and top lines indicate first and third centiles, the middle line represents median value, and the whiskers represent the range. (a) CD8+ FoxP3+ CD25− (CD8+ FoxP3+ Treg cells), (b) CD4+ CD25− FoxP3− T cells. Statistical differences were calculated by non‐parametric Mann–Whitney U‐test and the p‐values are given in the graph. NS, non‐significant.
