Figure 6.

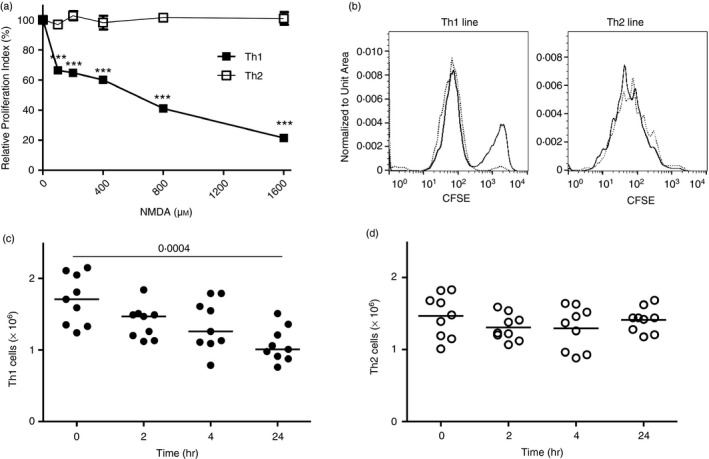
(a) Reduced proliferation of T‐cell receptor (TCR) ‐activated T helper type 1 (Th1) versus Th2 cell lines in the presence of N‐methyl‐d‐aspartate (NMDA). CFSE‐labelled Th1 and Th2 cells stimulated with anti‐CD3/CD28 for 24 hr then incubated with NMDA at the concentrations shown. Proliferation was determined at day 4 by flow cytometry. Relative proliferation indices were calculated in comparison to the proliferation index for groups lacking NMDA exposure as 100%. n = 6 experiments in total, ***P < 0·001. (b) CFSE FACS plots for representative Th1 and Th2 lines stimulated with anti‐CD3/CD28 in the presence/absence of 200 μm NMDA treatment. (c) Live cell number transition of Th1 and Th2 cell lines. Th1‐ or Th2‐driven cells obtained from five unique donors for each Th phenotype were anti‐CD3/CD28 stimulated as in (a), then incubated with 200 μm NMDA. Live cell numbers were determined by trypan blue counting at the indicated times. Paired t‐test is shown.
