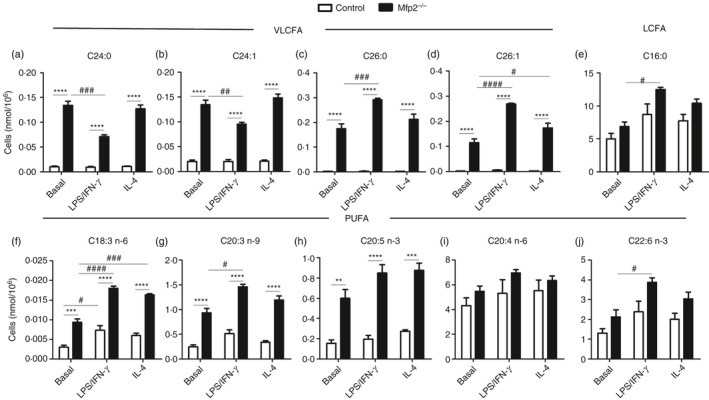
Figure 3.

Fatty acid composition of control and Mfp2 −/− bone‐marrow‐derived macrophages (BMDM) in different polarization states. (a–j) Representative examples (taken from the Supplementary material, Table S2) of fatty acid. (a–d) VLCFA – C24:0 (a), C24:1 (b), C26:0 (c) and C26:1 (d); (e) LCFA – palmitic acid (C16:0); (f–j) polyunsaturated fatty acids (PUFA) – γ‐linoleic acid (C18:3 n‐6) (f), mead acid (C20:3 n‐9) (g), eicosapentaenoic acid (20:5 n‐3) (h), arachidonic acid (C20:4 n‐6) (i) and docosahexaenoic acid (C22:6 n‐3) (j) in basal, classically or alternatively activated control and Mfp2 −/− BMDM (n = 3 versus 3). Bars represent mean ± SEM. Statistical differences based on two‐way analysis of variance test: **P < 0·01, ***P < 0·001, ****P < 0·0001 (Mfp2 −/− compared with control BMDM); #P < 0·05, ##P < 0·01, ###P < 0·001, ####P < 0·0001 (activated Mfp2 −/− and wild‐type BMDM compared with respective basal condition).
