
Figure 6.
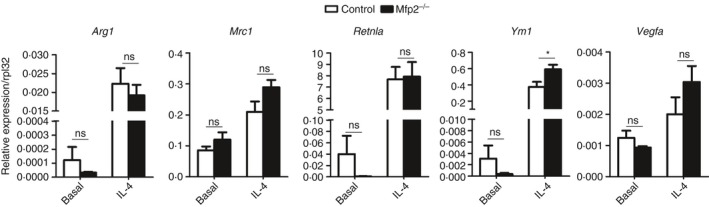
Unaltered anti‐inflammatory response of Mfp2 −/− bone‐marrow‐derived macrophages (BMDM). Gene expression of anti‐inflammatory markers in basal and alternatively activated Mfp2 −/− BMDM compared with control BMDM (n = 6 versus 6). Bars represent mean ± SEM. Statistical differences based on two‐way analysis of variance test: ns P > 0·05, *P < 0·05.