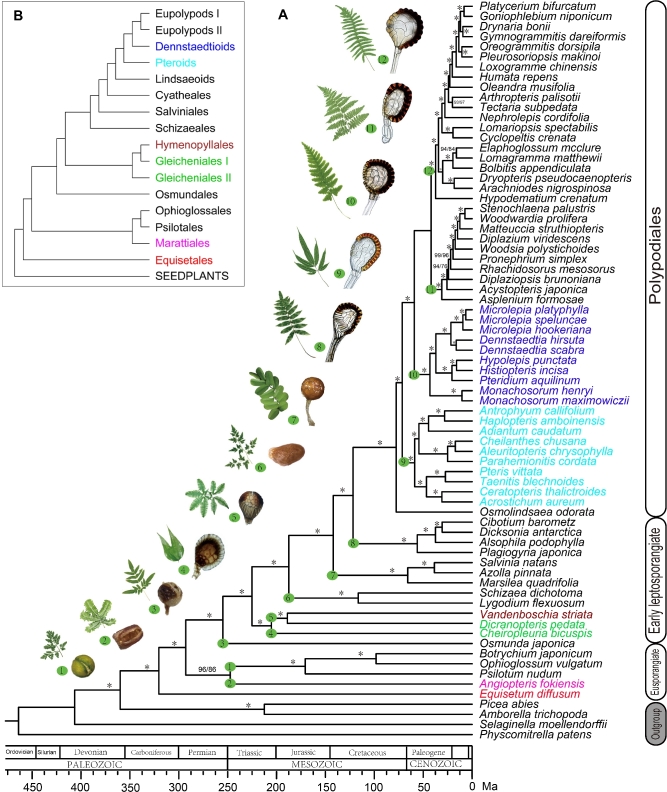
Figure 3:
Phylogeny of ferns reconstructed by coalescent-based method using nucleotide sequence with divergence times calculated. Support values for the main phylogeny (A) calculated from Matrix 1/Matrix 2 are listed as percentages. *Indicates 100%/100%. Representative leave(s), sporangium, and the corresponding lineage are labeled with a same number. Simplified topology (B) shows the main linages as in Fig. 1. Species in phylogeny (A) and the corresponding lineage in topology (B) are shown in the same color.

