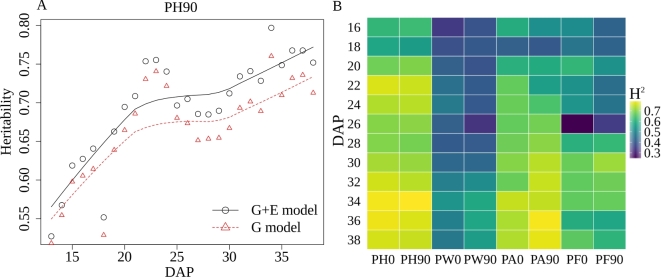
Figure 4:
(A) The time course broad sense heritability of PH90. The heritability in the G model was calculated using a linear model that only considers the effect of genotype with residual values in the error term while heritability in the G + E model was calculated using a linear model that considers the effect of both genotype and environment (row effect) with residual values in the error term. (B) The time course broad sense heritability of PA90 before and after controlling for the row effect. (B) Variation in broad-sense heritability ( ) after controlling row effects for 6 trait measurements every second day across the phenotyping cycle. PA0: Plant Area in 0 degrees (the major axis of leaf phylotaxy was parallel to the camera at 0 degree). PA90: Plant Area in 90 degrees (the major axis of leaf phylotaxy was perpendicular to the camera at 90 degrees). PH0: Plant Height in 0 degrees. PH90: Plant Height in 90 degrees. PW0: Plant Width in 0 degrees. PW90: Plant Width in 90 degrees. PF0: Average of plant fluorescence intensity in 0 degrees. PF90: Average of plant fluorescence intensity in 90 degrees.

