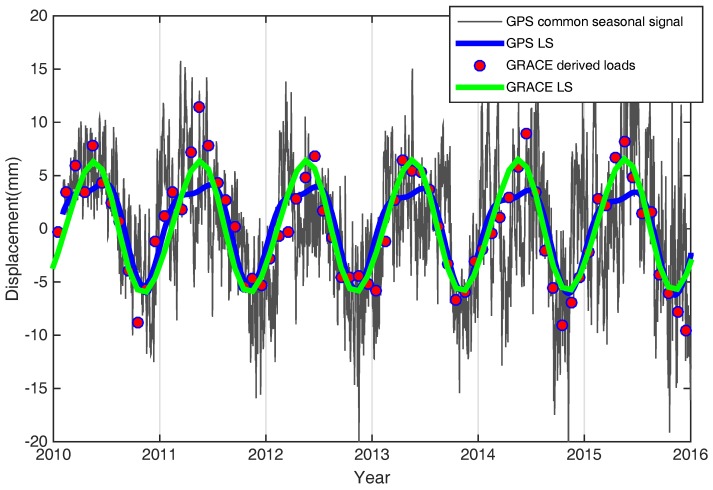
Figure 6.
Comparison of empirical orthogonal function (EOF) decomposed first common mode of GPS stations and stacked average GRACE records are from 2010 to 2016. Gray lines (daily solutions) and red dots (monthly solutions) correspond to the GPS and GRACE results, which are fitted by least squares (LS) (i.e., the blue and green lines, respectively).

