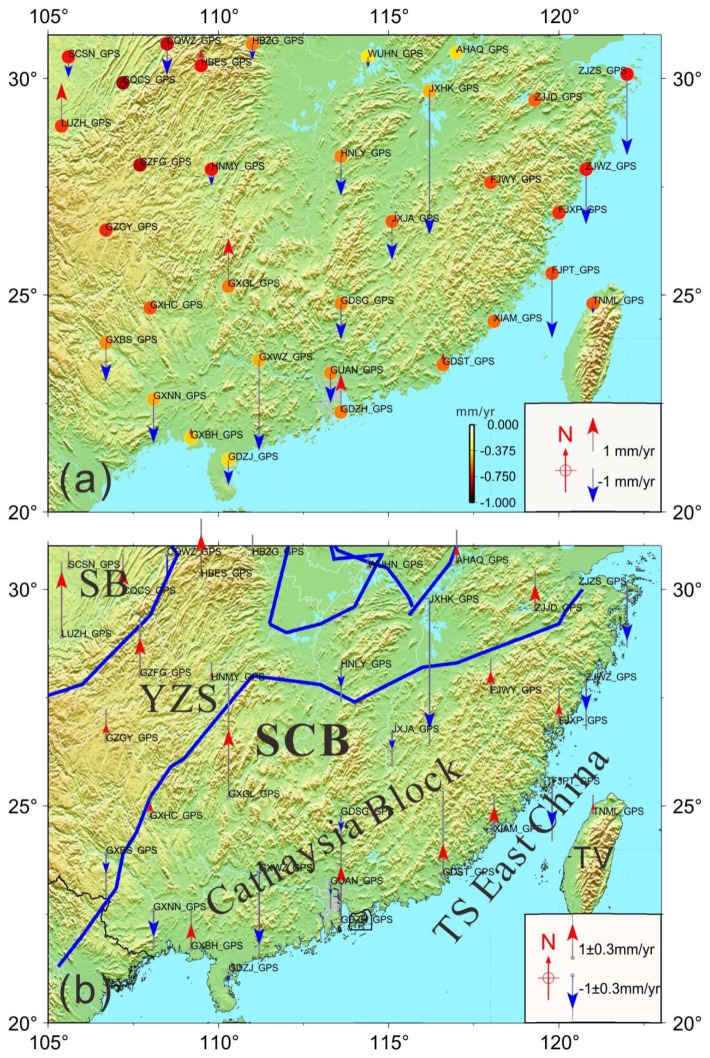
Figure 7.
(a) The GRACE-RL5 was used to estimate the gravity in Southern China, spanning from April 2002 to January 2016. The dots denote the vertical deformations caused by surface loads corresponding to the GPS sites location. The vertical vectors are GPS-derived raw vertical rates; (b) Vertical crustal tectonic movement of SCB with the loading effects removed (by using GPS-derived rates to subtract GRACE-model loads). Red vectors denote subsidence uplift, and blue vectors denote subsidence. The gray lines behind arrows are the uncertainty of all sites. The blue boundary lines are tectonic lines in the South China Block. SB: Sichuan Basin; YZS: Yangtze Craton; SCB: South China Block; TS: Taiwan Strait.

