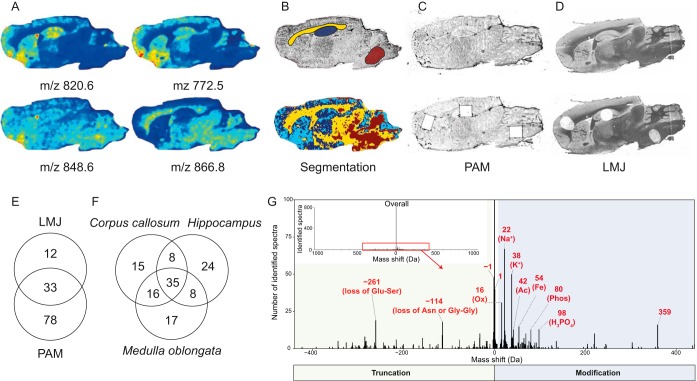
Fig. 1.
A, Molecular images after median normalization of spectra followed by medium denoizing and automatic hotspot removal. B, Optical image with highlighted regions of interest corpus callosum (yellow), hippocampus (blue) and medulla oblongata (brown) (top) and spatial segmentation analysis using the Bisecting k-Means approach using Correlation as the distance metric (bottom). C–D, Optical images of PAM and LMJ tissue sections with the top and bottom panels showing the tissue sections before and after ROI processing, respectively. E, Venn Diagram of the extracted proteins per technique (LMJ or PAM) and (F) global unique identifications using both strategies. G, Overall mass shifts of observed proteins precursors versus their theoretical masses (G, inset) and most abundant observed mass shifts within a ± 400 Da tolerance window (G) with annotation of known mass shifts. −114 Da corresponds to loss of “Asn” at N-term of ATP synthase-coupling factor 6, mitochondrial or loss of “Gly-Gly” at C-term of Ubiquitin monomer and −261 corresponds to loss of Glu-Ser at C-term of Thymosin beta-4.

