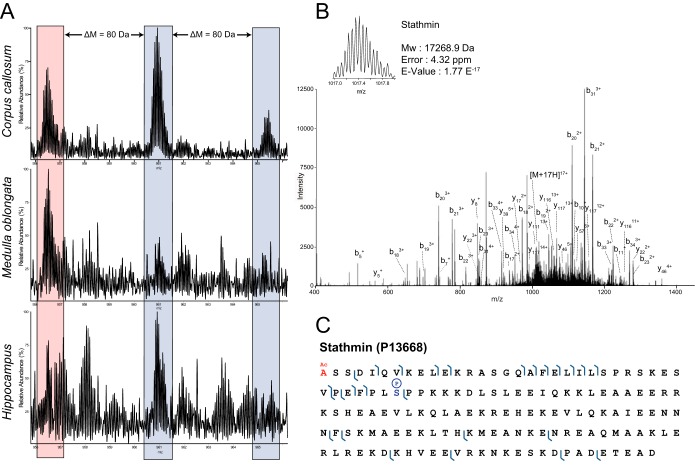
Fig. 4.
ROI-specific PTM profile of Stathmin (A), which was identified in corpus callosum and medulla oblongata but not in hippocampus. N-terminal acetylation is marked red, whereas the phosphorylations are marked blue. Precursor (z = 17) and assigned fragmentation spectrum of Nter-Acetylated and phosphorylated (Ser-38) Stathmin (B) and fragmentation map (C).

