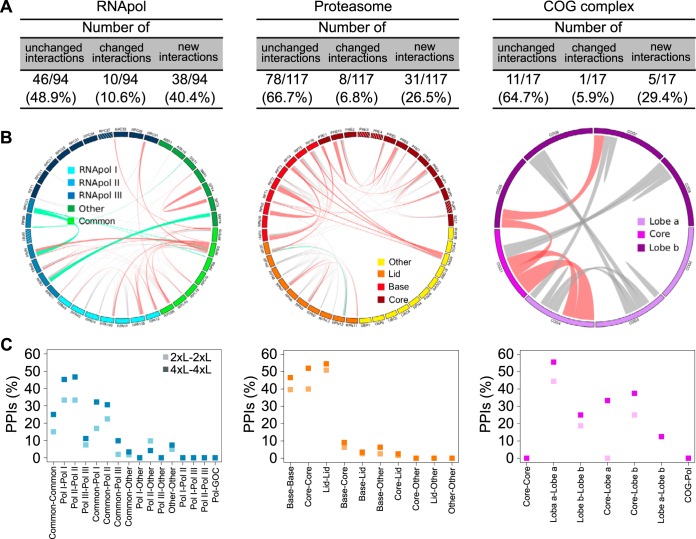
Fig. 3.
The use of a longer linker proves to be useful to infer the super-organization of protein complexes. A, Proportions of quantitatively changed PPIs and new PPIs versus unchanged PPIs for all complexes considering every reciprocal interactions such as X-DHFR F[1,2]-Y-DHFR F[3] and Y-DHFR F[1,2]-X-DHFR F[3] as a single PPI. B, Circle plots of all detected PPIs for each complex. Line thickness is proportional to the difference between the 4xL-4xL and 2xL-2xL PCA signal for each PPI. Gray lines: unchanged PPIs. Green lines: negatively changed PPIs. Pink lines: positively changed and new PPIs. Stripe patterns inside the colored boxes represent proteins that were absent from the experiment. C, Proportion of PPIs detected for each combination of subcomplexes within complexes.

