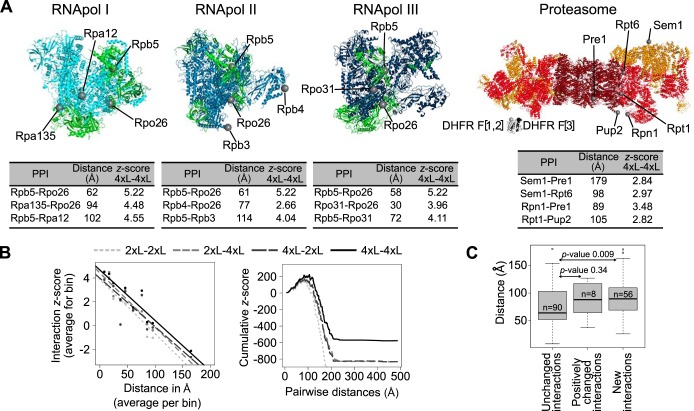
Fig. 4.
Longer linkers allow for the detection of PPIs among more distant proteins within complexes. A, Structures of the RNApol I, II, and III and of the proteasome. Green: proteins shared by at least two out of the three RNApol. Dark red: proteasome catalytic subunit. Red: proteasome base. Orange: proteasome lid. Proteins located at different distances or in different subunits are highlighted on each structure. Examples of distances between C-termini of these proteins and their associated PPI Zs. PPIs detected with longer linkers but not with the 2xL are indicated in the tables. DHFR fragments have also been modeled and are presented at the same scale as the proteasome structure. B, (Left) Correlation between all of the detected PPIs in the proteasome (Zs) and the distance between the C-termini (2xL-2xL: Spearman r = -0.34, p-value = 2.249e-15; 2xL-4xL: r = -0.36, p-value < 2.2e-16; 4xL-2xL: r = -0.36, p-value < 2.2e-16; 4xL-4xL: r = -0.40, p-value < 2.2e-16). Data were binned into 10 classes for representation only, the correlation tests were performed on raw data. (Right) Distribution of cumulative Zs for the proteasome PPIs as a function of protein pairwise distances. C, Pairwise C-termini distances for the PPI that are not affected by linker length, those that have enhanced interaction score (Is) and those that were not detected with the 2xL but are detectable with the 4xL. Data from the RNApol and proteasome complexes are combined in these analyses. p-values of Wilcoxon tests are shown.

