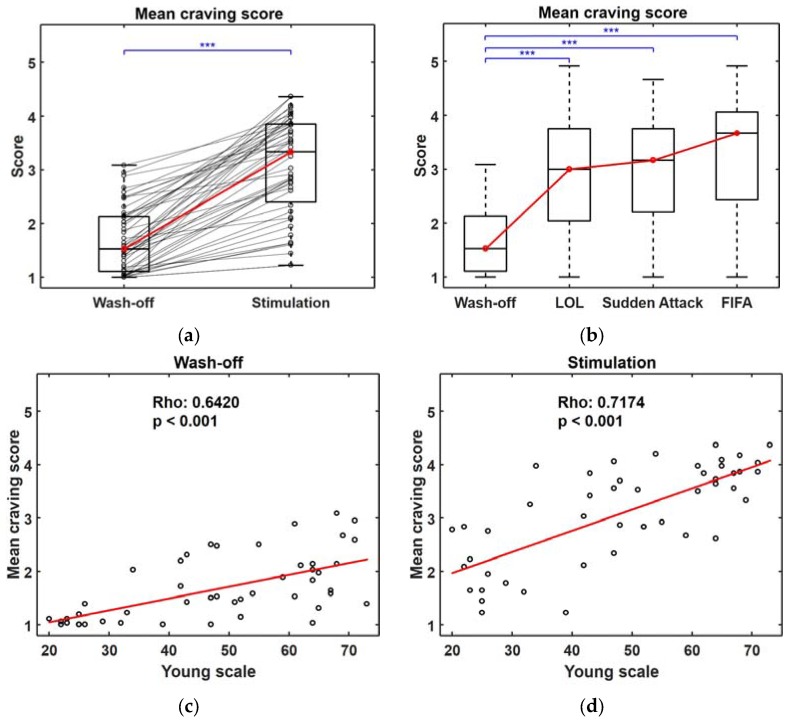
Figure 2.
Analysis of the self-reported craving scores of 47 participants. (a) Boxplots of mean craving scores after “Wash-off” and “Stimulation” trials. The scores of each participant are indicated using black circles and lines, and the median values of each distribution are indicated using red circles and red lines; (b) Boxplots of mean craving scores with respect to different game types. Red circles and lines indicate the median values of each distribution, and *** represents (p < 0.001); (c,d) Relationships between the Young scale and individual participants’ mean craving scores after “Wash-off” and “Stimulation” trials.

