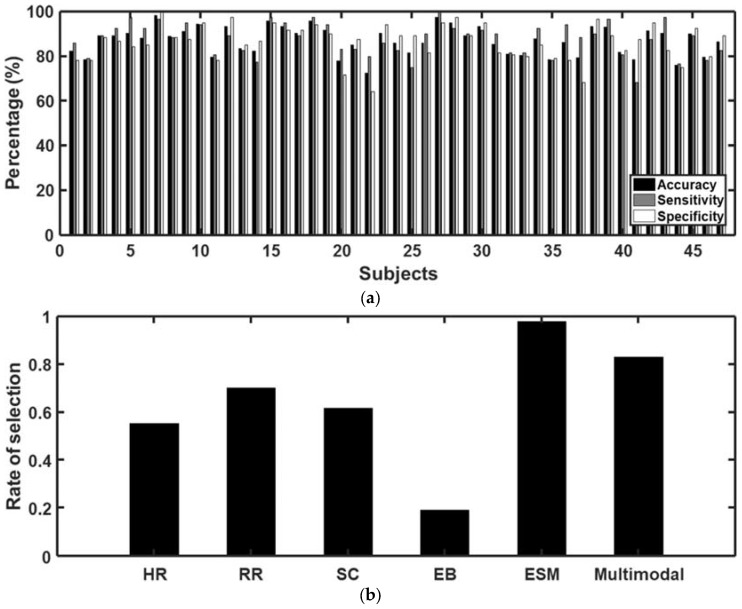
Figure 5.
Results of classification of craving states. (a) Performance of the binary classification of craving states validated through 10-fold cross-validation. Black, grey, and white bar graphs indicate the average accuracy, sensitivity, and specificity, respectively. The average accuracy was 87.04%, when the sensitivity and specificity were 87.71% and 86.37%, respectively; (b) The rate of selection of each kind of feature in the classification. HR, RR, SC, EB, ESM, and Multimodal represent the heart rate, respiratory rate, skin conductance, eye blink, eye saccadic movement, and multimodal covariance features, respectively. The detailed results are presented in Table S1 of the supplementary materials.

