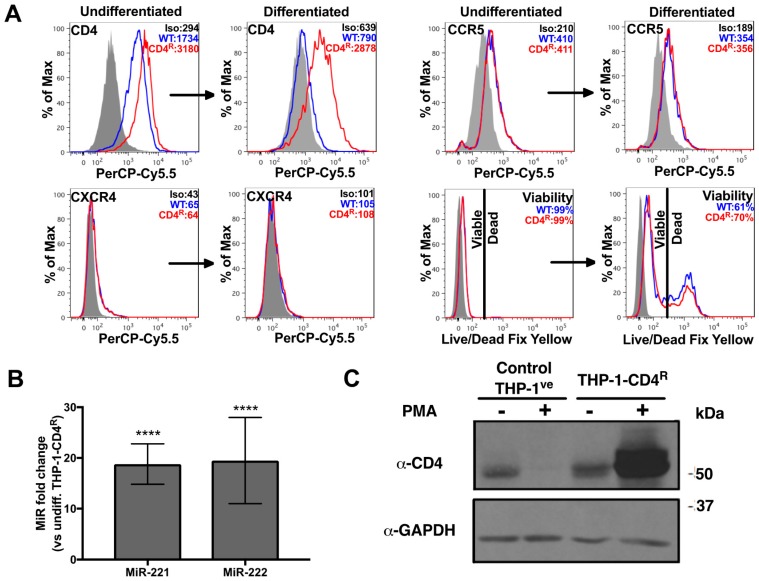
Figure 4.
THP-1-CD4R cells express CD4 independently of miR-221 and miR-222 modulation. **** p < 0.0001. (A) Either undifferentiated or PMA-differentiated THP-1-CD4R cells (or the control THP-1ve cells, WT) were analyzed for their viability and the surface levels of CD4, CXCR4 or CCR5 by cytofluorometry. Representative graphs are shown. Mean geometric fluorescence intensities (MFIs) or viability values are shown in the histograms. (B) The expression of miR-221 or miR-222 was compared in THP-1-CD4R cells prior or after differentiation (n = 12; means ± SD are shown and compared using Student’s t test). (C) Expression of CD4 was measured by western blot in either control THP-1ve or THP-1-CD4R cells, prior or following PMA-induced differentiation. A representative blot is shown.

