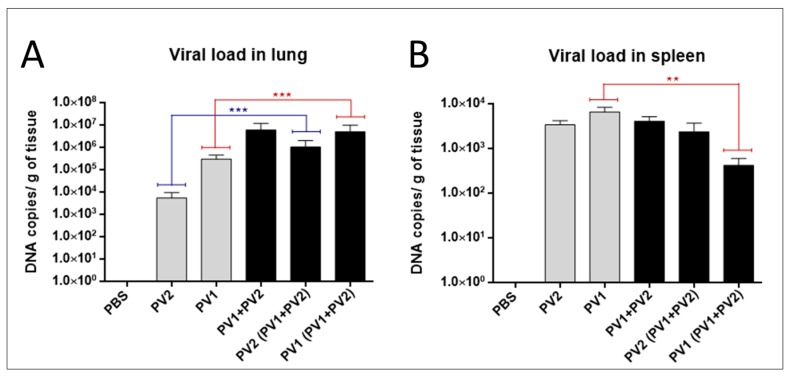
Figure 5.
Viral load in mono or coinfected PV1-GII and PV2-GI mice. Viral loads in: lungs (A); and spleen (B) of Balb/c mice monoinfected (grey columns) and coinfected (black columns) with PV1-GII and PV2-GI were determined by qPCR. Comparisons between mono and coinfected groups are highlighted in red (PV1-GII groups) and blue (PV2-GI groups). The error bars indicate standard deviations. The statistical tests used were One-Way ANOVA and Tukey’s multiple comparisons test Asterisks indicate a statistically significant difference: ** p < 0.01; *** p < 0.001. PV1: Pelotas virus 1; PV2: Pelotas virus 2; PBS: phosphate-buffered saline.

