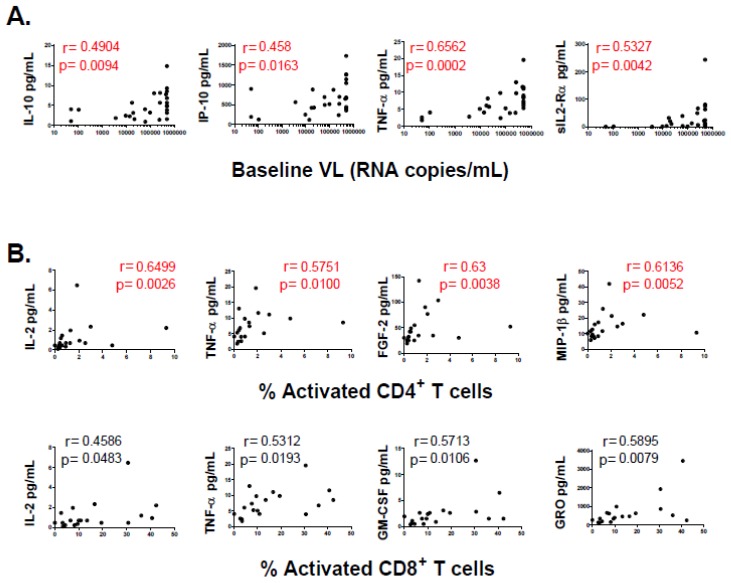
Figure 5.
Correlations between plasma level of denoted cytokines and chemokines (evaluated at baseline samples) versus: plasma viral load (VL) (A); and baseline immune activation (B) (percentages of CD38+/HLA-DR+ CD4+ (upper panels) and CD8+ (lower panels) T-cells). Dots represent data from individual subjects. In the inset, r (upper line) and p (lower line) values correspond to Spearman’s test. After correction for multiple comparisons (FDR procedure) was applied, only those correlations shown in red remained statistically significant.

