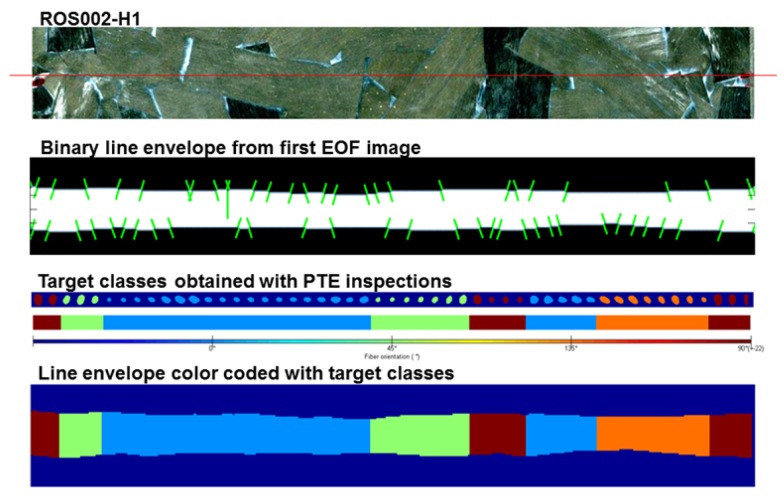
Figure 6.
Class assignment of a line inspection. The line was divided into 49 samples and for each one of this samples a PTE spot inspection was performed in order to define the individual’s class. e.g., the PTE inspection assessed a fiber orientation of 16°, the class of this particular individual would be 0 (or Class 1000 according to the output neurons). The colors considered here are the same as the ones applied in Figure 5.

