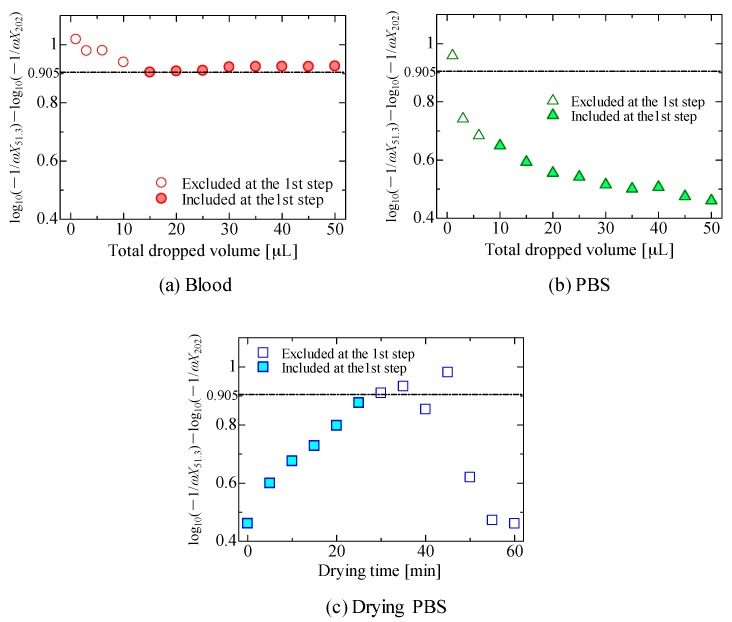
Figure 8.
Slope values of log10(−1/ωX51.3) − log10(−1/ωX202), as a function of the volume obtained when (a) blood or (b) PBS was dropped to the sensor. The slope value as a function of the sensor’s drying time in which a total volume of 50 μL of PBS was dropped is shown in (c). Excluded and included conditions at the first selection step, estimated from Figure 7, are indicated in each figure. Furthermore, the minimum slope value shown in (a) is 0.905, which is indicated in other figures as a visual guide.

