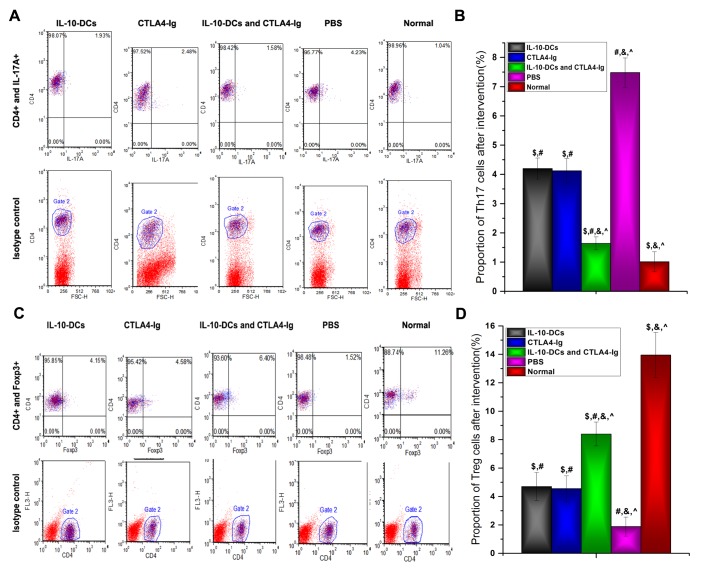
Figure 3.
Proportion of Th17 and Treg cells as analyzed by flow cytometry. (A) CD4+IL-17A+ cells were identified as the Th17 cell subset and (B) analyzed. (C) CD4+Foxp3+ cells were identified as the Treg cell subset and (D) analyzed. Th, T helper cells; Treg, regulatory T cells; CD, cluster of differentiation; IL, interleukin; Foxp3, forkhead box protein P3; DCs, dendritic cells; CTLA4-Ig, cytotoxic T lymphocyte antigen 4-immunoglobulin; PE, phycoerythrin; Normal, untreated C57Bl/6J mice. $P<0.05 vs. the PBS group post-intervention, #P<0.05 vs. the normal group, &P<0.05 vs. the IL-10-DCs group, ^P<0.05 vs. the CTLA4-Ig group.

