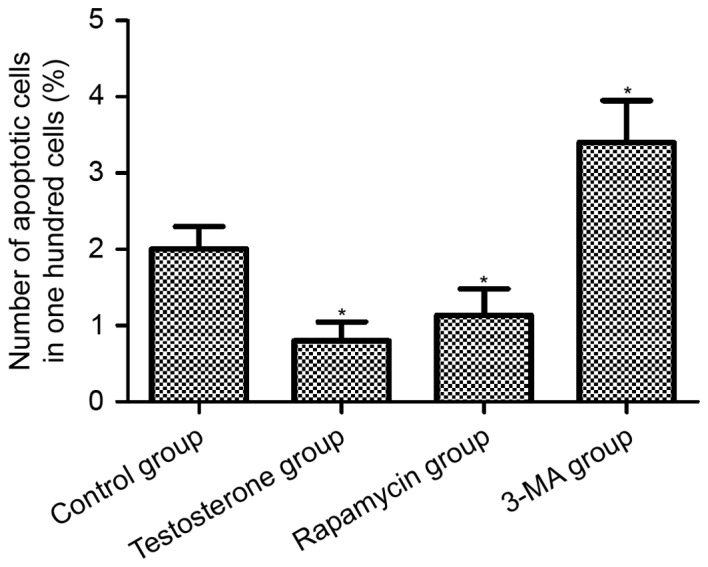
Figure 6.

Rate of apoptosis in rat prostate tissue after 28 days of treatment. The longitudinal axis represents the number of apoptotic cells per 100 cells in a microscopic field (magnification, ×40). Data are presented as mean ± standard deviation. *P<0.05 vs. the Control group. 3-MA, 3-methyladenine.
