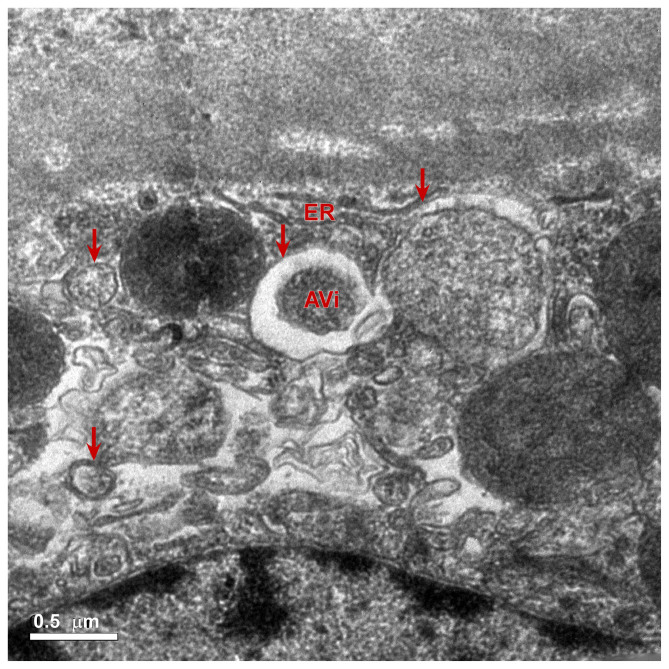
Figure 7.
Electron microscopic observation of prostate tissue of rapamycin group after 28 days of treatment (magnification, ×5,000). Ultrathin sections were double-stained with 1% uranyl acetate and 0.2% lead citrate and analyzed by transmission electron microscopy. Red arrows indicate autophagy. Under the electron microscope, vesicles with a single layer membrane structure in the cells were observed. Incomplete digested organelles and other contents were also observed in the autophagosome. Scale bar, 0.5 µm. AVi, autophagosomes or initial autophagic vacuoles; ER, endoplasmic reticulum.

