
Figure 1.
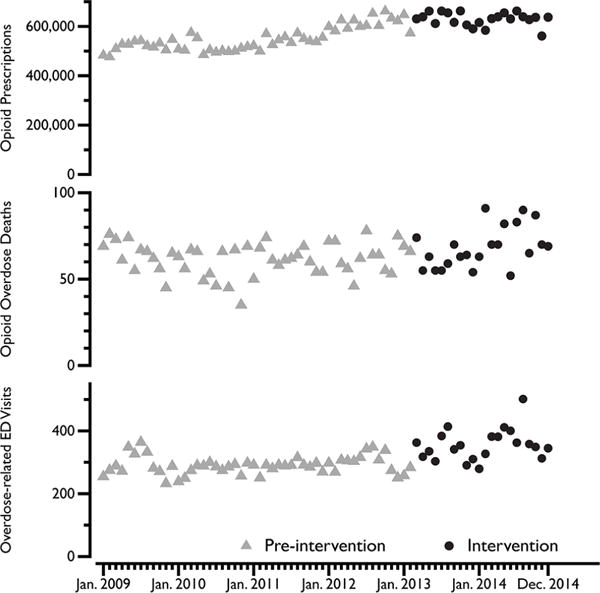
Monthly counts of outcomes before and during intervention, North Carolina, 2009–2014. Statewide, monthly counts of outpatient opioid analgesic (OA) prescriptions dispensed, opioid overdose mortality and overdose-related hospital emergency department (ED) visits. In subsequent modelling, OA prescriptions dispensed was treated as a covariate, while overdose was the outcome variable. Grey triangles represent the pre-intervention period used in models (January 2009 to February 2013) and the black dots represent the intervention period (March 2013 to December 2014). By the end of the intervention period, the intervention was implemented in 74 of 100 counties, representing 70% of the total population.