
Figure 2.
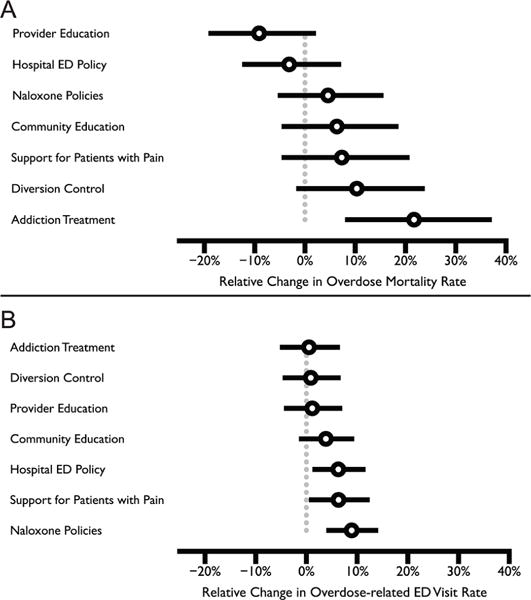
Effects of implementing intervention strategies on overdose mortality and overdose-related emergency department (ED) visits. The outcome for A and B are overdose mortality and overdose-related ED visits, respectively. Results from multivariate regression models considered all seven intervention strategies simultaneously, after adjusting for the rate of opioid analgesic prescriptions, county health status, annual trends and seasonality. The models used to generate the figures used 0 for the referent group, and 1 for the implementation of the strategy, with indicator coding. IRRs (tables 1 and 2) were converted to percent change, represented by open circles. The horizontal bars are the model-based 95% CI. The grey vertical line represents the null.