
Figure 3.
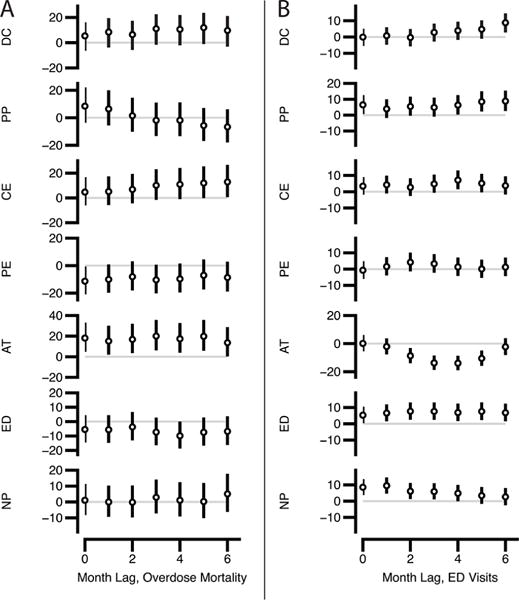
Effects of implementing intervention strategies in time-lagged regression models of delayed impact of intervention.The vertical axis is percent change in overdose rates between intervention and non-intervention counties; the outcome in A is overdose mortality and B is overdose-related emergency department (ED) visits. Results from time-lagged (0 to 6 months) multivariate regression models considered all seven intervention strategies simultaneously, after adjusting for the rate of opioid analgesic prescriptions and county health status. AT, greater utilisation of addiction treatment; CE, community education; DC, diversion control; NP, take-home naloxone policies; PE, prescriber education on pain management and addiction; PP, support programme for patients with pain.