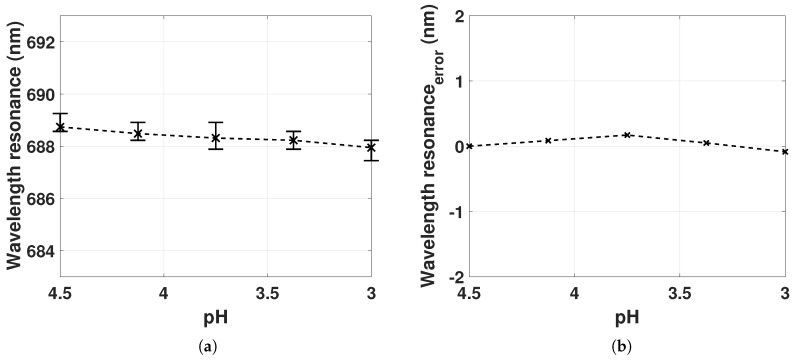
Figure 7.
(a) LSPR peak position measured for the hydrogel deswelling from pH 4.5 to 3.0 for two sampled series with mean, minimum and maximum values from 4 sampled LSPR peak positions; (b) the error of the LSPR peak position by holding the reference spectrum constant at for pH 4.5 to 3.0. RI = 1.33 (Milli-Q water).

