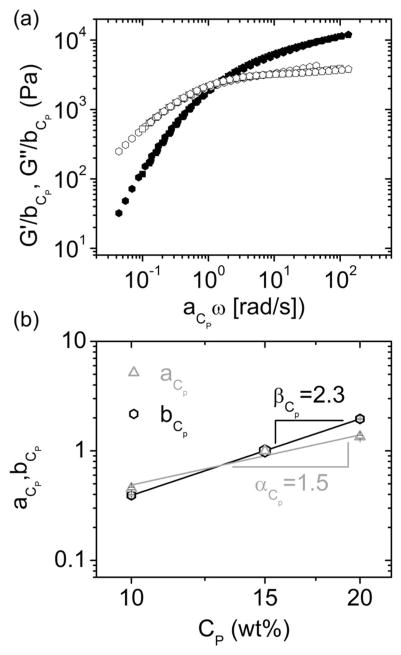
Figure 4.
Superposition of frequency sweep data for polymer concentrations ranging from 10 to 20 wt% (as shown in Figure 3). (a) Polymer concentration invariant master curves of P(8)20-AA ionic gels formed at a calcium concentration of 100 mM. Storage (G′) and loss (G″) moduli are represented by the same symbols as in Figure 2a. (b) Horizontal (aCp) and vertical (bCp) shifts were determined from the superposition fitting, and are shown as a function of polymer concentration.

