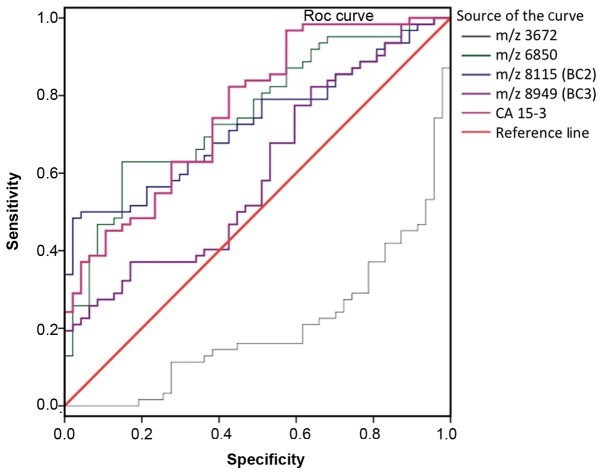
Figure 2.
ROC curve for each protein peak identified using SELDI-TOF-MS in patients with breast cancer compared with non-cancerous individuals. Area under curve values were as follows: m/z 3,972, 0.700; m/z 6,850, 0.752; m/z 8,115, 0.732; m/z 8,949, 0.603; CA15-3, 0.762. ROC, receiver operating characteristic; SELDI-TOF-MS, surface-enhanced laser desorption ionization time-of-flight mass spectrometry; CA15-3, carbohydrate antigen 15-3.

