
Figure 2.
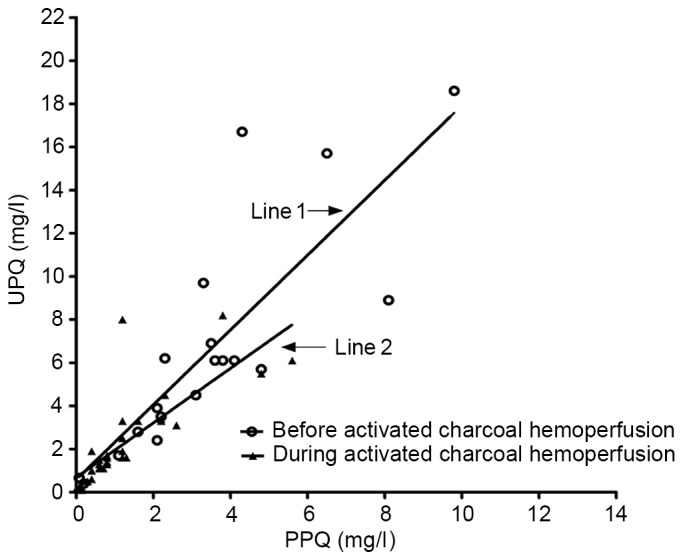
Line 1, correlation between PPC and UPC prior to HP therapy. Regression line, Y=0.5820+1.7348X (R2=0.678; F=35.768; P<0.0001); Line 2, correlation between PPQ and UPQ during HP therapy. Regression line, Y=0.6827+1.2649X (R2=0.626; F=50.308; P<0.0001). PPC, plasma paraquat concentration; UPC, urine paraquat concentration; HP, charcoal hemoperfusion.