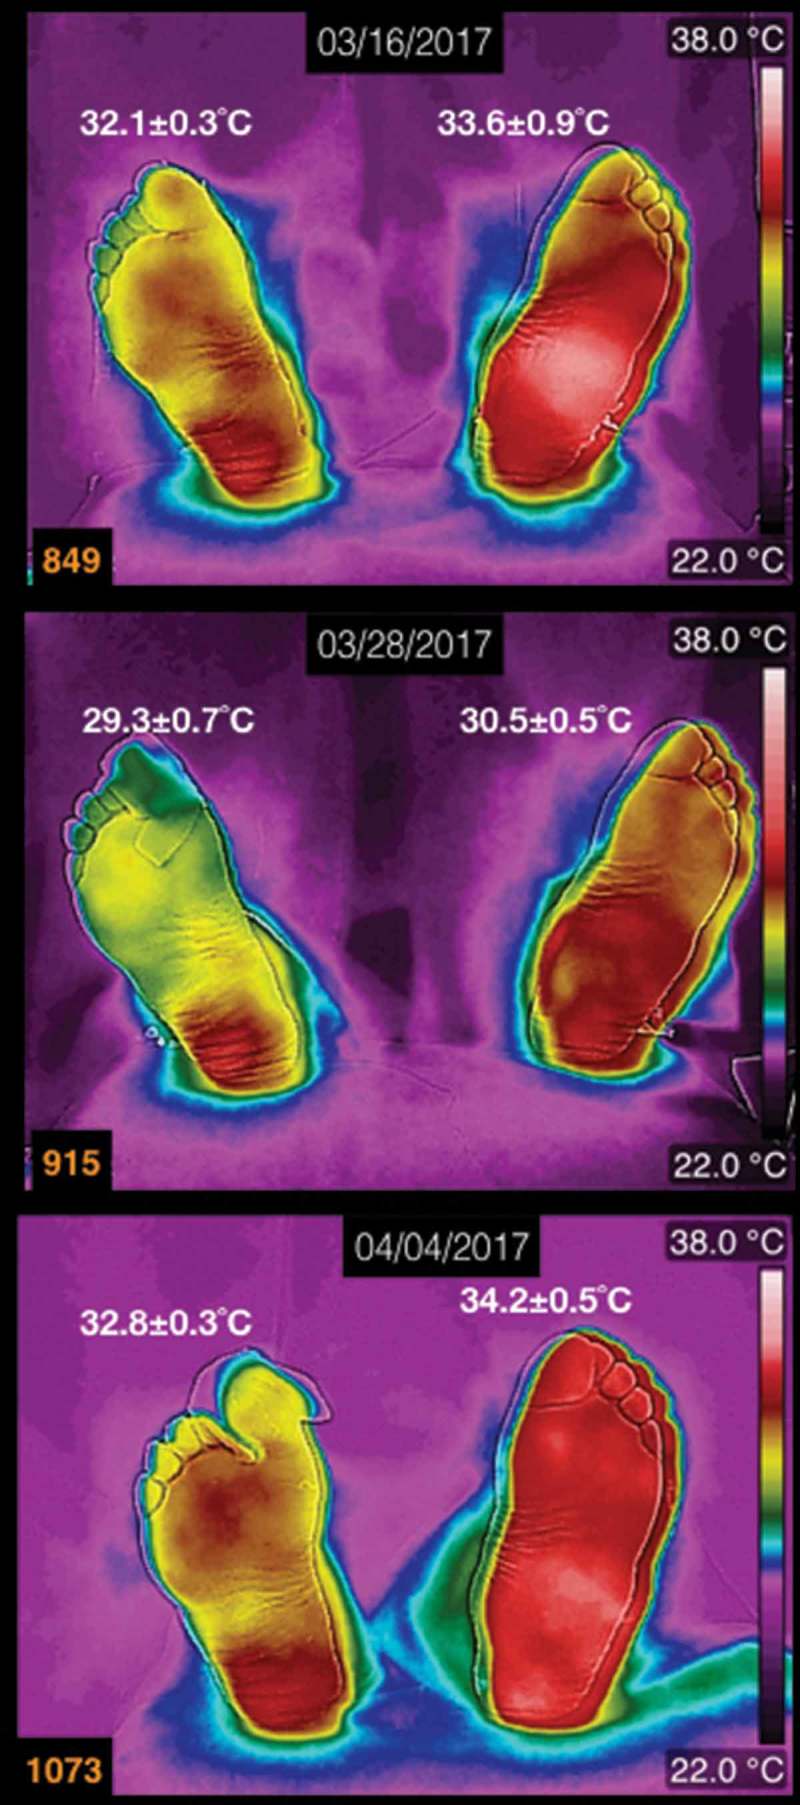
Figure 2.

Three thermograms of the plantar skin of a diabetic patient, with the left Charcot foot. The date of the acquisition of the thermogram is at the the top of each thermogram. The average temperatures are written above each foot. This patient is a male, 62 years old, 27 years with diagnosis of diabetes mellitus.
