
Figure 4.
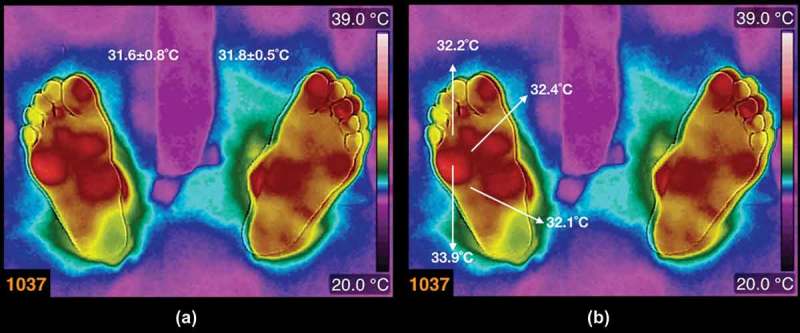
(a) Thermogram from a diabetic patient (the average temperatures are written above each foot). The patient is a female, 48 years old, BMI 38.7 kg/m2, 12 years with diagnosis of diabetes mellitus. (b) The arrows show the temperatures on the hot spot and some samples of the temperatures surrounding the hot spot.