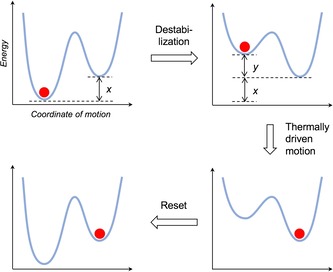
Figure 1.

Schematic representation of the thermally driven motion of a chemical system biased by an energy input (y). The state of the system with respect to the motion coordinate is identified by the position of the red circle on the potential energy curve.
