Figure 3.
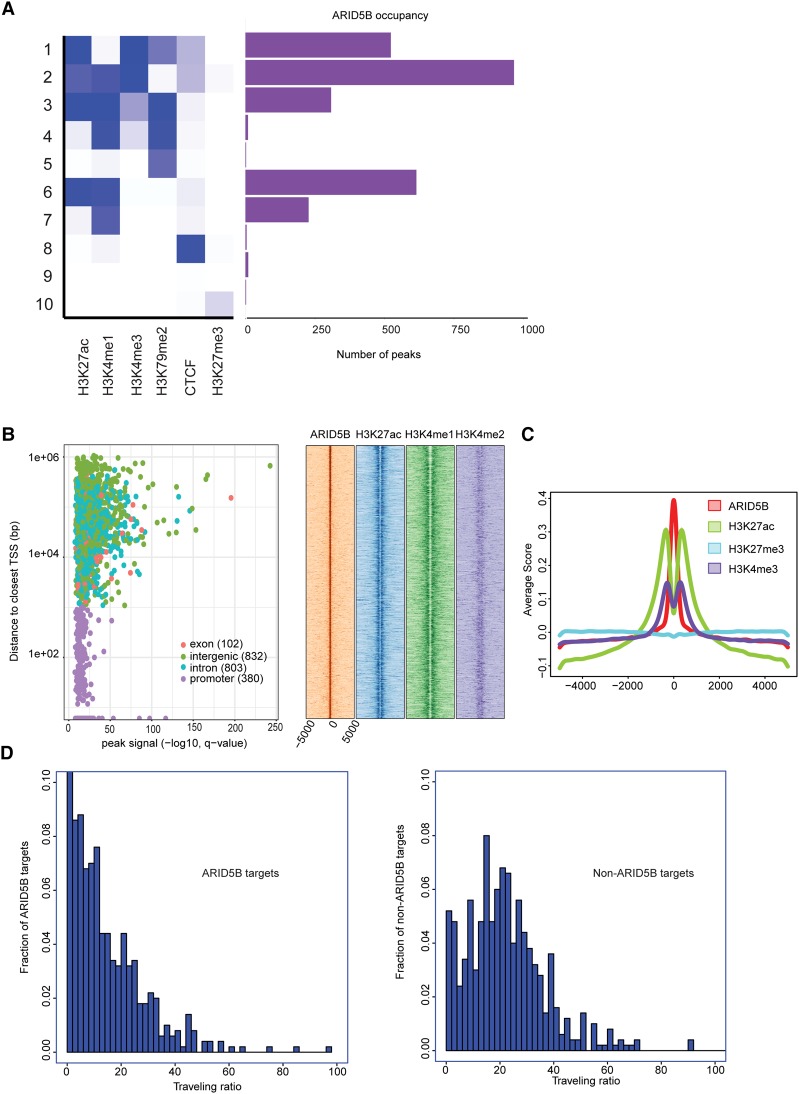
ARID5B-bound regions are associated predominantly with active transcription. (A) Ten different chromatin states were first defined using published ChIP-seq data sets for various histone marks and CTCF in Jurkat cells. The number of peaks of ARID5B for each state is shown. (B) Each region bound by ARID5B was first mapped to the closest gene and classified into one of four categories: promoter, exon, intron, or intergenic. (Left) A scatter plot shows all ARID5B-bound regions plotted by distance from the closest TSS (Y-axis) and ARID5B signals (X-axis). (Right) The density plots show distributions (base pairs) of H3K27ac, H3K4me1, and H3K4me2 at nonpromoter regions bound by ARID5B in Jurkat cells. (C) Metagene analysis showing distribution (base pairs) of H3K27ac, H3K27me3, and H3K4me3 at the ARID5B-bound nonpromoter regions in Jurkat cells. (D) Histograms were made for the fraction of ARID5B targets/nontargets with the given traveling ratio values for the 500 active genes with the highest ARID5B signals (left) and the 500 active genes with the lowest ARID5B signals (right).

