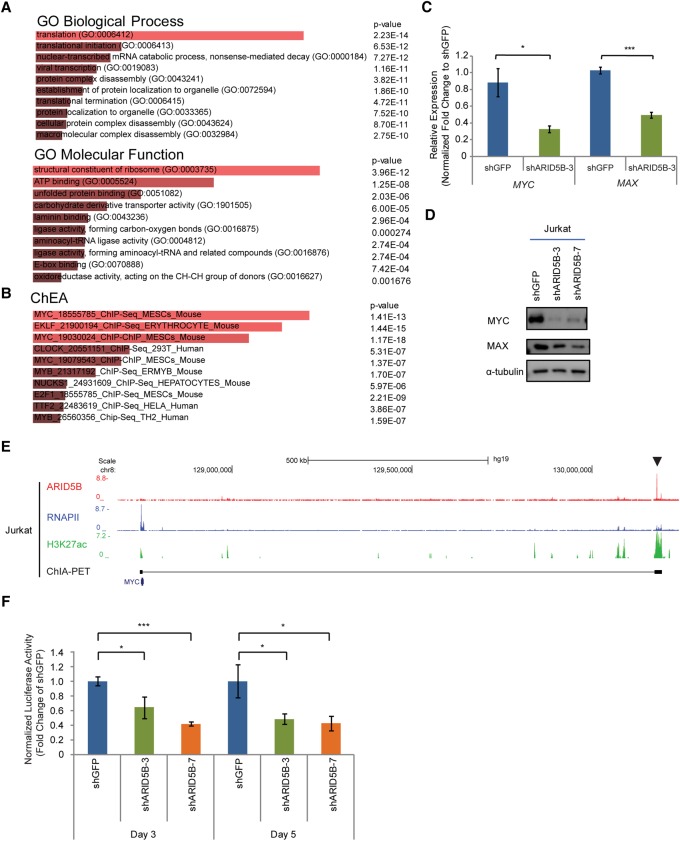
Figure 4.
ARID5B transcriptionally activates the oncogene MYC in T-ALL cells. (A,B) GO analysis (A) and ChEA (B) were performed in the Enrichr program using 1202 genes that were significantly down-regulated after ARID5B knockdown (with an adjusted P-value of <0.05 and a log2 fold change of less than −0.5 between two control and two knockdown samples). The top 10 terms ranked by combined score are shown. (C) mRNA expression of MYC and MAX in Jurkat cells on day 3 after ARID5B knockdown was measured by qRT–PCR analysis. The relative gene expression was normalized to the ERCC spike-in exogenous control (E130). The data represent the mean ± SD of duplicate samples. (*) P < 0.05; (***) P < 0.001 by two-sample two-tailed t-test. (D) Western blot analysis for protein expression of MYC, MAX, and α-tubulin (loading control) in Jurkat cells on day 3 after lentivirus transduction. (E) The ChIP-seq gene tracks represent the binding of ARID5B and RNAPII, the presence of H3K27ac, and chromatin interactions determined by ChIA-PET (cohesin) analysis at the NOTCH1-driven MYC enhancer (N-Me) region (arrowhead) in Jurkat cells. See the legend for Figure 1F for details. (F) Luciferase activity driven by the N-Me was measured after ARID5B knockdown in Jurkat cells. The luciferase activity on days 3 and 5 was normalized to shGFP (control). The data represent the mean ± SD of duplicate samples. (*) P < 0.05; (***) P < 0.001 by two-sample two-tailed t-test.

