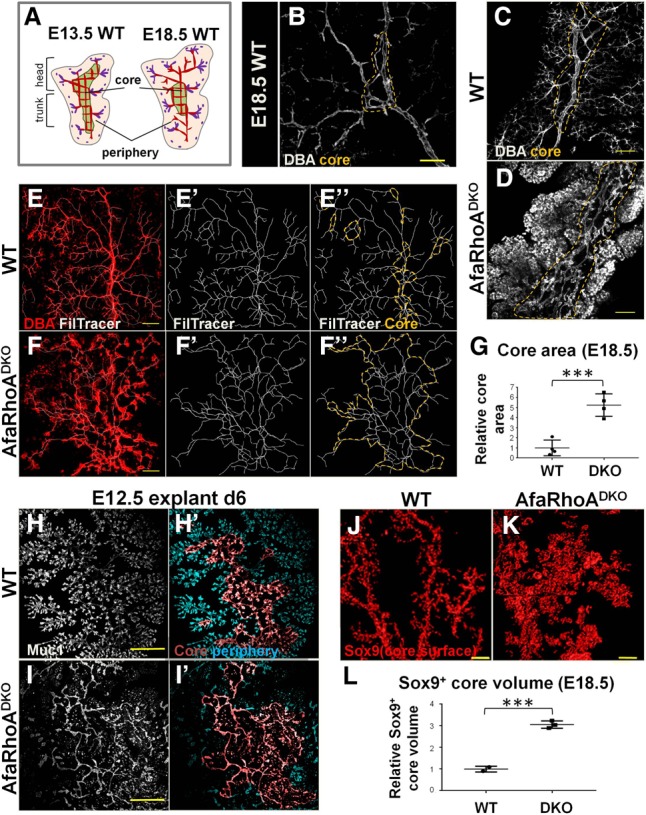
Figure 6.

Arrest of lumen morphogenesis leads to ectopic perdurance of the core. (A) The schematic illustrates the distinction between the core and the periphery in the murine embryonic pancreas and the transient nature of the core–periphery regionalization. The pink region corresponds to the periphery with lumen branches, while the green region represents the core with an interconnected plexus (red) mid-remodeling. The central plexus undergoes remodeling to form branches as the tips continue to form de novo lumens and fuse with the lumen branches arising from the center. Red lumens in the periphery represent lumens arising from the remodeling of central lumens, and purple lumens represent lumens arising de novo. Purple dots indicate the most recent transiently discontinuous de novo lumens. Plexus remodeling takes place gradually, encompassing inward to the center of the tissue as more central plexus lumens become hierarchical branches. Thus, the core region becomes gradually smaller relative to the periphery. (B) E18.5 wild-type pancreata whole-mount-immunostained for DBA to mark large and mid-sized ducts. A maximum projection of the z-stack is shown. The dotted line outlines core lumens. Bar, 40 µm. (C,D) E18.5 wild-type and DKO pancreata whole-mount-immunostained for DBA. The pancreatic trunk is shown. Summed slices (50 µm) through z-stack are shown. The dotted line outlines core lumens. Representative images from four independent experiments are shown. n = 4 embryos per genotype. Bars, 100 µm. (E–F″) E18.5 wild-type and DKO pancreata whole-mount-immunostained for DBA. A pancreatic head is shown. (E,F) The maximum projection of z-stacks is shown; the Filament Tracer function in Imaris tracks lumens and creates a continuous counterpart of lumens. (E″,F″) The orange dotted line indicates the core region. Representative images from four independent experiments are shown. n = 4 embryos per genotype. Bars, 150 µm. (G) Quantification of the core area using Filament Tracer analysis on pancreata from wild-type (n = 3 embryos) and DKO (n = 3 embryos). Representative images are shown in E–F″. (H–I′) E12.5 wild-type and DKO pancreatic explants cultured for 6 d (d6), fixed, and immunostained for Muc1. Lumens were traced using Filament Tracer. Core and peripheral lumens are highlighted in different colors by using the Surface function in Imaris. Representative images from three independent experiments are shown. n = 4 embryos per genotype. Bars, 300 µm. (J,K) E18.5 wild-type and DKO pancreata whole-mount-immunostained for Sox9. The Surface function in Imaris was used to visualize the total Sox9+ surface area in the core region. Head region of the pancreas is shown. Representative images from three independent experiments are shown. n = 4 embryos per genotype. Bars, 150 µm. (L) E18.5 core volume calculated on Sox9 whole-mount-stained wild-type (n = 2) and DKO (n = 3) pancreas head regions using surface function in Imaris. Representative images are shown in J and K. See also Supplemental Figure S6.
