Figure 3.
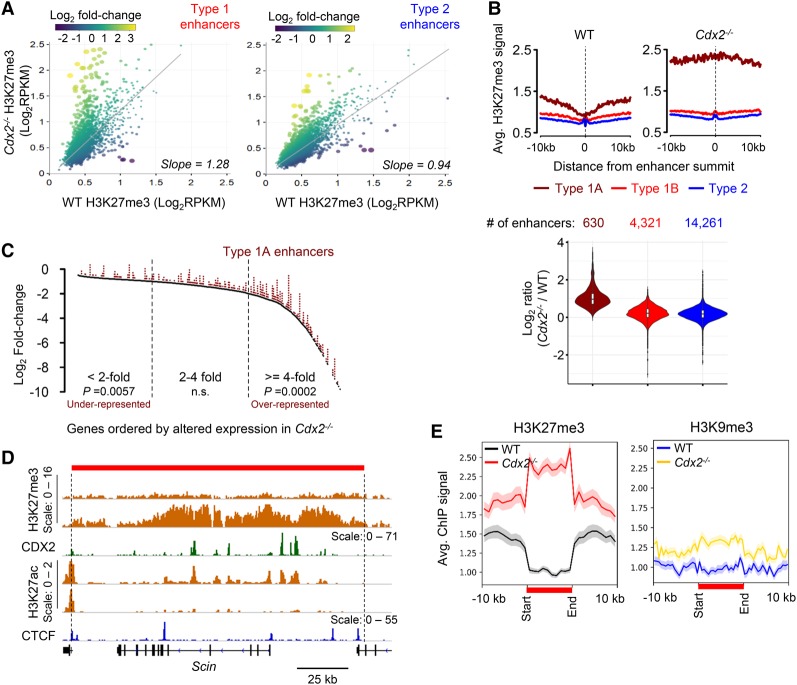
The absence of CDX2 leads to H3K27me3 accumulation in extended regions surrounding type 1 enhancers. (A) Scatter plots of average H3K27me3 signals (RPKM values, n = 2) at all type 1 (left) and type 2 (right) regions ±2.5 kb from enhancer summits in wild-type (X-axis) versus Cdx2−/− (Y-axis) villi. Dot colors represent log2 fold changes in H3K27me3, and dot diameters represent the statistical significance of the difference (−log10 P-value). Slopes of linear regression (gray lines) differ significantly (P < 0.0001) for type 1 and type 2 enhancers. (B) H3K27me3 ChIP signals ±10 kb from the summits of enhancers of types 1A, 1B, and 2, represented as average profiles in wild-type and Cdx2−/− villi, revealing high basal H3K27me3 near type 1A sites, further increased in the Cdx2−/− epithelium. (Bottom) Violin plots for ratios of normalized ChIP-seq counts in Cdx2−/− and wild-type cells verify the selective increase at type 1A enhancers. (C) Type 1A enhancers are overrepresented near (±100 kb) genes reduced fourfold or greater in Cdx2−/− villi. P-values are indicated ([n.s.] not significant) for the fractions of genes where association with type 1A enhancers deviates from expected values. (D) A representative locus, Scin, showing significant H3K27me3 gain in Cdx2−/− cells. The red bar denotes a well-demarcated domain of H3K27me3 gain, with boundaries adjacent to CTCF (blue)-binding sites and TSSs of neighboring genes. Scales refer to the signal range in genome tracks. (E) Aggregate plots of the 322 regions depleted of H3K27me3 in wild-type intestines and gain of this mark, but not of H3K9me3, in Cdx2−/− intestines. All affected domains are scaled to 10 kb and depicted in relation to regions 10 kb (unscaled) upstream and downstream. Shaded areas represent the standard error of the mean (SEM).

