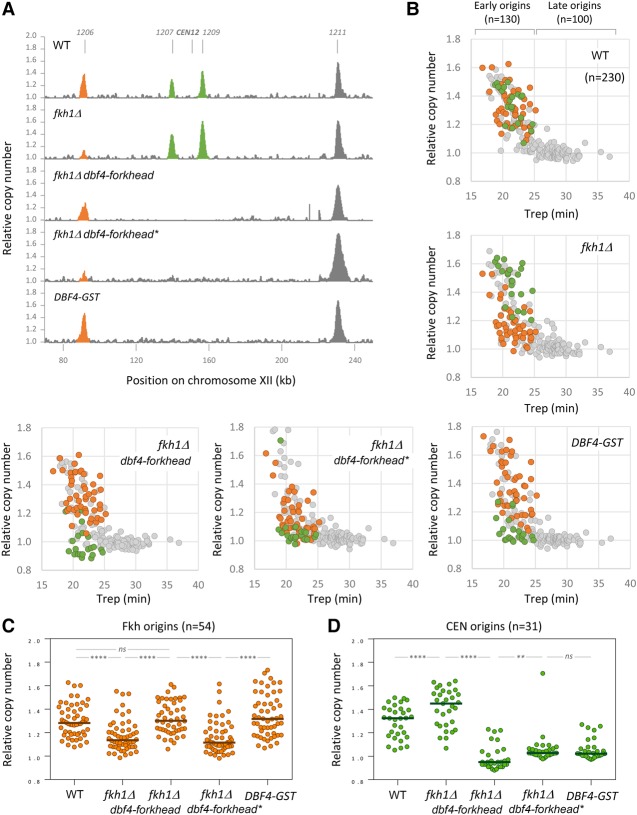
Figure 4.
Genome-wide analysis of origin usage in wild-type and fkh1Δ cells. (A) Replication profiles of wild-type, fkh1Δ, fkh1Δ DBF4–forkhead, fkh1Δ DBF4–forkhead*, and DBF4-GST cells for a representative region on chromosome XII. Cells were arrested in G1 for 170 min and released synchronously into S phase for 60 min in the presence of 200 mM HU. Relative copy number was determined by deep sequencing as the ratio of normalized reads in HU and G1 cells. Peaks corresponding to Fkh-dependent origins are labeled in orange, and pericentromeric origins are labeled in green. (B) Scatter plots of relative DNA copy number in wild-type, fkh1Δ, fkh1Δ DBF4–forkhead, fkh1Δ DBF4–forkhead*, and DBF4-GST cells versus the Trep (Yabuki et al. 2002) for 230 origins. Fkh1-dependent origins are labeled in orange, and pericentromeric origins are labeled in green. (C) Relative copy number at Fkh origins (n = 54) in wild-type, fkh1Δ, fkh1Δ DBF4–forkhead, fkh1Δ DBF4–forkhead*, and DBF4-GST cells. (D) Relative copy number at CEN origins (n = 31) in wild-type, fkh1Δ, fkh1Δ DBF4–forkhead, fkh1Δ DBF4–forkhead*, and DBF4-GST cells. (****) P < 0.0001; (**) P < 0.01; (ns) nonsignificant, Wilcoxon matched-pairs signed rank test.

