Figure 1.

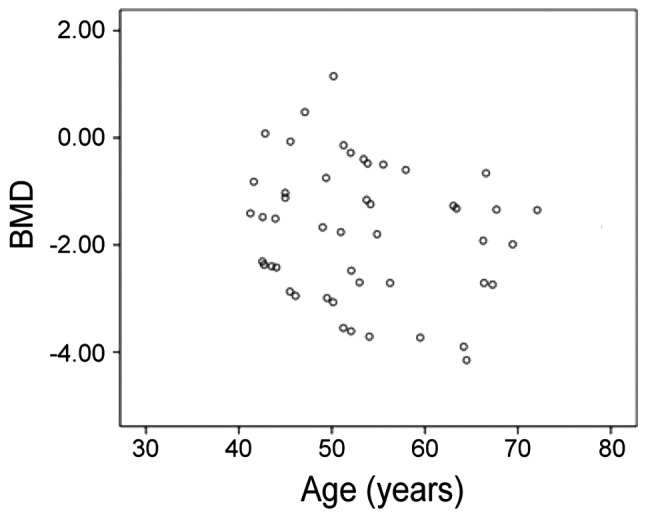
Scatter diagram about the relationship between age and BMD of BPPV patients in treatment group before treatment: the BMD t-value of patients shows a gradually decreasing trend with the increase of age.

Scatter diagram about the relationship between age and BMD of BPPV patients in treatment group before treatment: the BMD t-value of patients shows a gradually decreasing trend with the increase of age.